POWER BI PROJECT
Data Professionals Survey Breakdown
A comprehensive Power BI project visualizing the landscape of data careers, analyzing salaries, languages, and work-life balance from over 600 survey respondents.
Project Overview & Data Cleaning
This project transforms raw survey data into an interactive dashboard that reveals the "state of the industry" for data professionals. By ingesting responses regarding job satisfaction, salary, and technical skills, the report provides a clear window into career trends.
Before visualization, the raw data underwent rigorous cleaning using Power Query to ensure accuracy and consistency.
ETL Process
- Job Title Standardization: Merged similar roles (e.g., "Data Analyst II" to "Data Analyst") to create cleaner categories.
- Language Processing: Parsed multi-select responses to isolate and count favorite programming languages individually.
- Salary Normalization: Converted salary ranges into numeric averages to enable calculation of mean metrics.
Key Insights & Visualizations
Survey Taker Overview
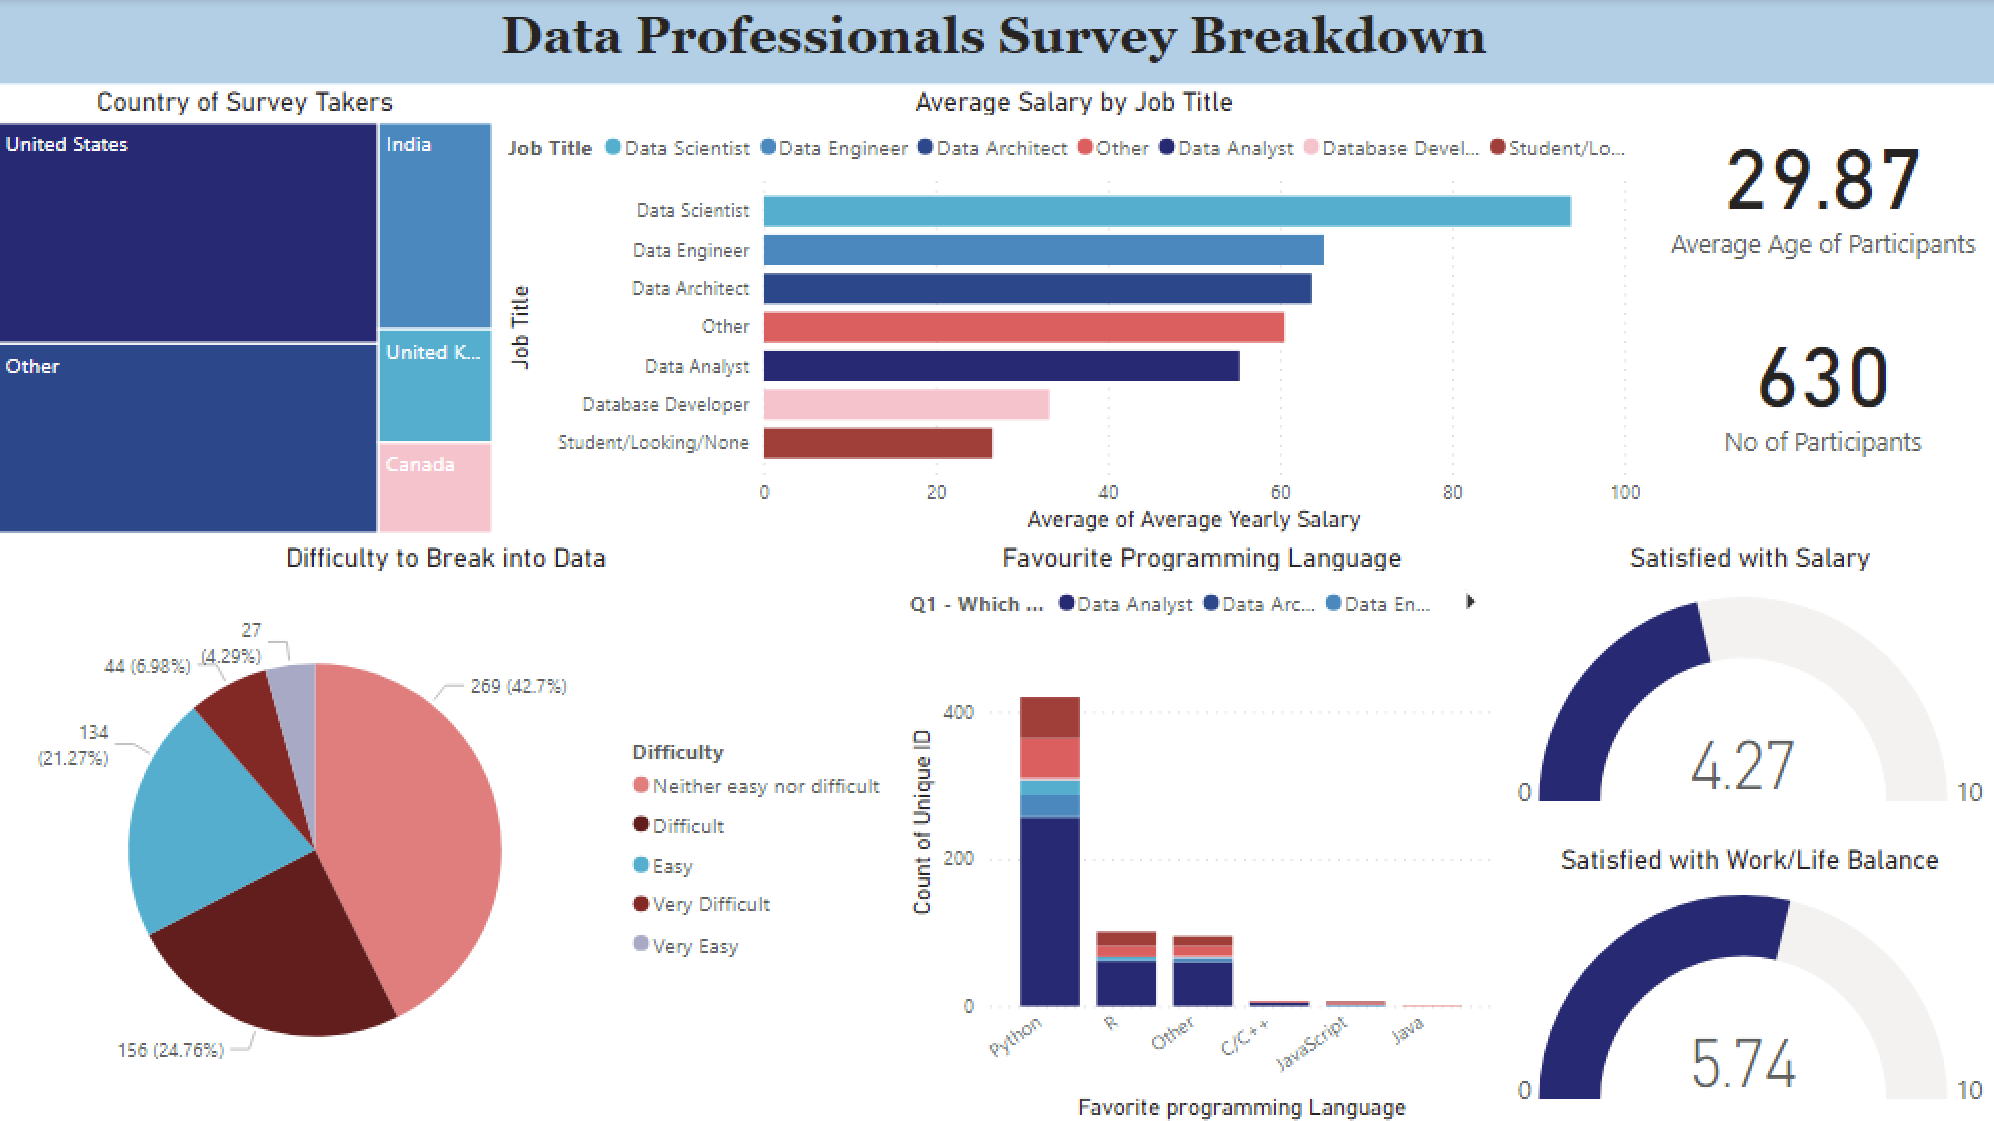
A high-level summary utilizing KPI cards to display the total count of unique survey participants and their average age, establishing the demographic baseline of the dataset.
Title & Salary Analysis
Comparative analysis showcasing average salary for each standardized job title through clustered bar charts, identifying the highest-paying roles in the industry.
Programming Languages
Visualizes the popularity distribution of different coding languages (Python, R, SQL) to help professionals prioritize skill acquisition.
Global Distribution
A TreeMap illustrating the volume of respondents from different countries, offering a geospatial view of where the data workforce is concentrated.
Satisfaction Gauges
Dual gauges displaying the average satisfaction scores (1-10) for Work-Life Balance and Salary, providing a quick "pulse check" on industry happiness and identifying areas for improvement in employee retention.
Interactive Dashboard
Explore the survey insights in the Power BI dashboard below.
Outcomes & Final Thoughts
This project showcases the end-to-end data analysis workflow, from ETL in Power Query to DAX calculations and final visualization. It provides valuable insights for individuals navigating their data careers and highlights the importance of data cleaning in delivering accurate business intelligence.